
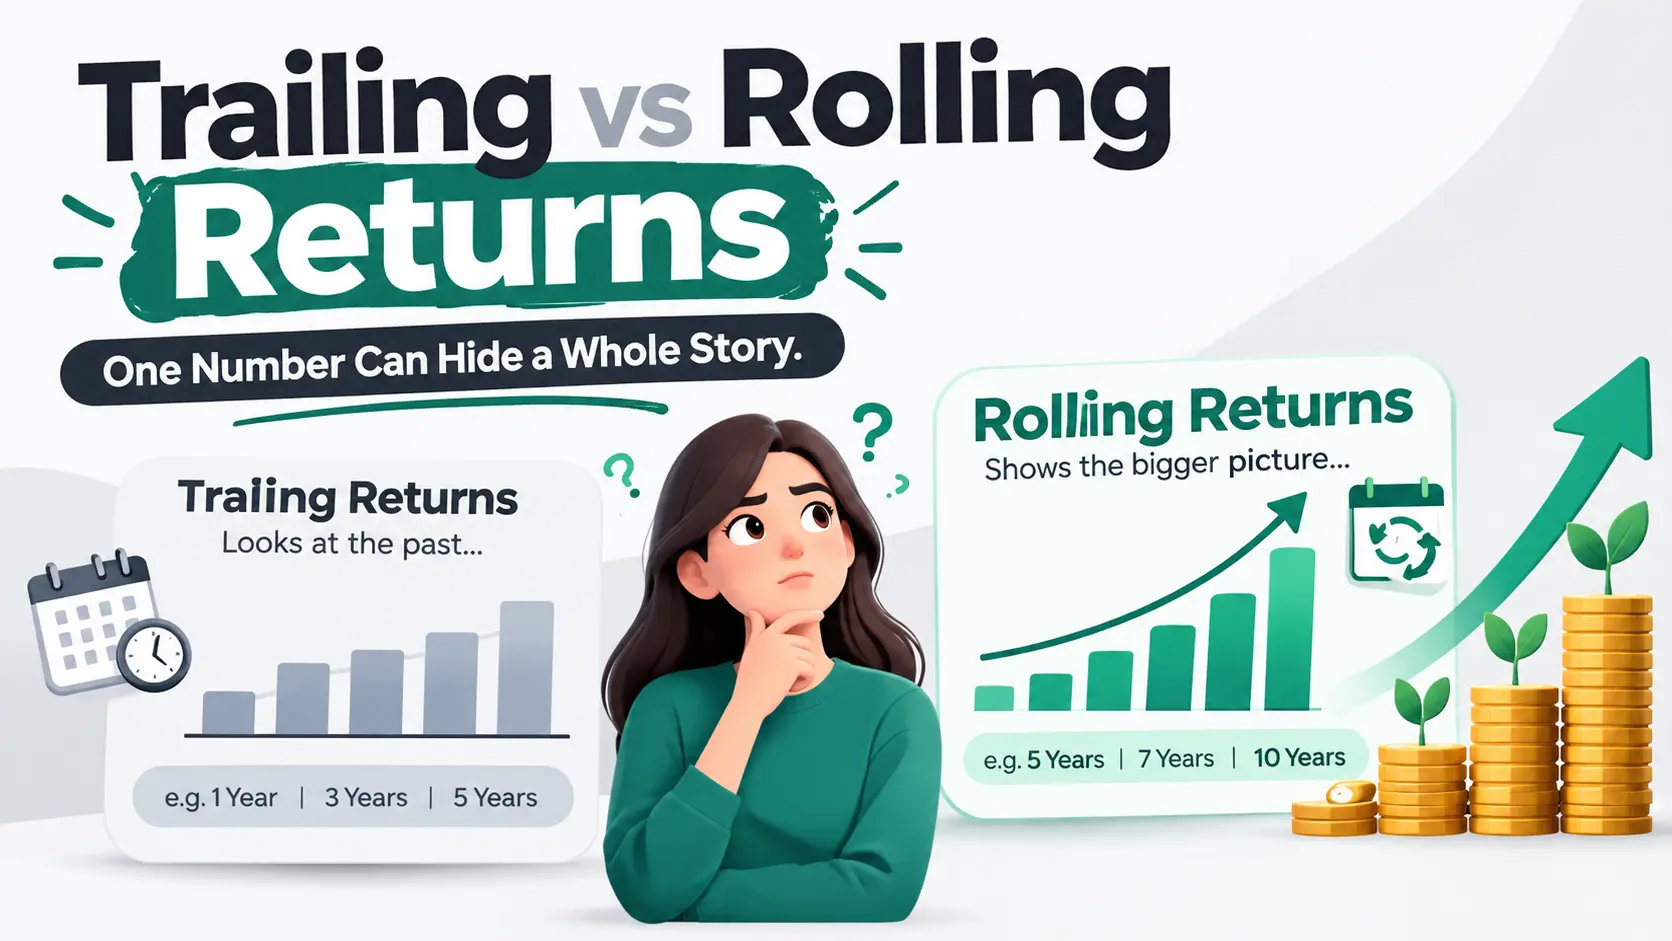
Short answer: a trailing return is a single snapshot from one start date to today, and it can be flattered by a lucky end date, while a rolling return tests every possible start date and shows you the full range of what the fund actually delivered. The same fund can advertise a shiny 16 percent trailing 5-year return while its rolling 5-year record reveals an average nearer 11 percent, a best window of 22 percent, and a worst window of just 2 percent. One number tells a story. The other tells the truth. Let me show you how a favorable end date can dress up a mediocre fund, and how to see through it.
What a trailing return is, and its weakness
A trailing return, also called a point-to-point return, measures the fund’s growth from one fixed date in the past to today. It is what fund fact sheets and ads show by default for 1, 3, 5, and 10 years. The math is a simple CAGR:
\text{Trailing Return} = \left(\frac{\text{NAV}_{\text{end}}}{\text{NAV}_{\text{start}}}\right)^{\frac{1}{n}} - 1The weakness is baked into that formula: it depends entirely on two dates. Shift the end date into a bull run and the number soars. Let the start date sit at a market bottom and the number soars again. The very same fund can show an 18 percent 5-year return one month and a 9 percent 5-year return a few months later, without the fund itself changing at all. A trailing return is one photograph, and the fund gets to choose the flattering angle. This is the same endpoint sensitivity that lets a 5-year SIP occasionally end below cost, which we cover in can a SIP give negative returns.
What a rolling return is
A rolling return refuses to rely on one lucky date. Instead, it calculates the return for every possible window of a given length across the fund’s history, then summarizes them. For a 5-year rolling return, you compute the return for the window starting each month, roll forward, and repeat:
\text{Rolling Return}_t = \left(\frac{\text{NAV}_{t+n}}{\text{NAV}_{t}}\right)^{\frac{1}{n}} - 1You do this for hundreds of start dates, then look at the distribution: the average, the best window, the worst window, and how often the fund cleared a useful threshold. Instead of one photo, you get the whole film. That is what tells you whether a fund is consistently good or just caught a good moment.
The same fund, two lenses
Here is where the gap becomes obvious. Take a fund proudly advertising a 16 percent trailing 5-year return, and look at the same fund through rolling 5-year windows.
| Measure | 5-year figure |
|---|---|
| Trailing return (measured to today) | 16% |
| Rolling return, average across all windows | About 11% |
| Rolling return, best window | About 22% |
| Rolling return, worst window | About 2% |
| Share of windows that beat 12% | About 40% |
The advertised 16 percent is not a lie, but look where it sits. It is near the top of the fund’s own range, not the middle. The typical 5-year investor in this fund earned closer to 11 percent, and an unlucky one who started at the wrong time earned just 2 percent. Only about 4 in 10 windows even cleared 12 percent. The trailing number caught a favorable end date and put its best face forward, while the rolling distribution shows a merely decent, sometimes disappointing, fund.
How one favorable end date flatters a mediocre fund
Picture a fund that drifted for four years and then rode a sharp market rally in the last twelve months. Measured to today, its trailing 5-year return looks fantastic, because the recent surge lifts the end point. But most investors did not start exactly five years ago. Someone who started six years ago, or four, had a very different experience, and the rolling windows capture all of them. The ad shows you the one window that happens to end on a high. Rolling returns show you the dozens of windows that did not. This is why comparing a fund’s advertised number to your own result can feel jarring, a gap we explain in why your fund’s advertised return isn’t the return you got.
How to use rolling returns to judge a fund
When you look at a fund’s rolling returns, focus on three things, not just the average.
- The average across windows. This is a fairer estimate of what a typical investor earned than any single trailing figure.
- The worst window. This tells you the downside you must be able to stomach. A fund whose worst 5-year window was 2 percent is very different from one whose worst was minus 5 percent, even if their averages match.
- Consistency, or how often it delivered. A fund that beat 12 percent in 80 percent of windows is more dependable than one that did so in 40 percent, even if the second had a higher peak. Consistency is what you can actually plan around, which is why we always suggest planning with realistic averages in our SIP calculator.
Where to be careful
Rolling returns are powerful, but keep two things straight. First, a rolling return still is not your personal return. Your own result depends on when your SIP money went in, which is your XIRR, explained in XIRR vs CAGR. Rolling returns describe the fund, XIRR describes you. Second, rolling returns need history to compute, so a brand-new fund cannot show them at all, which is one more reason a new fund offer gives you less to judge, as we cover in is an NFO a good investment. When a fund can only wave a single trailing number at you, treat it with healthy suspicion.
The bottom line
A trailing return is one date’s worth of luck. A rolling return is the whole record. A fund can advertise 16 percent while its rolling history quietly reveals an 11 percent average and a 2 percent worst case, and nothing about that is illegal or even unusual. It is just the difference between a flattering snapshot and an honest distribution. Before you trust a fund’s headline number, ask for its rolling returns, look at the average, the worst window, and how often it delivered. That is how you tell a genuinely good fund from one that simply ended on a high note.
A trailing return measures a fund’s growth from one fixed past date to today, so it depends heavily on that single end date. A rolling return calculates the return over every possible window across the fund’s history and summarizes them, revealing the average, best, and worst outcomes. Rolling returns show consistency, while trailing returns show one snapshot.
Because rolling returns remove the luck of a single start or end date. By testing hundreds of windows, they show how consistently a fund performed and what its worst stretch looked like, not just one flattering figure. This gives a fairer picture of what a typical investor would likely have earned.
Yes. A trailing return is very sensitive to its end date, so a recent market rally can inflate it, making a mediocre fund look excellent. The same fund can show very different trailing returns in different months. Rolling returns expose this by showing the full range of outcomes across many start dates.
You calculate the return for a window of a chosen length, such as 5 years, starting on each date in the fund’s history, then roll the window forward and repeat. This produces hundreds of return figures, which are summarized into an average, a best and worst window, and the share of windows that beat a chosen threshold.
No. Rolling returns describe the fund’s behavior across many periods, while your personal return, your XIRR, depends on when your own money was invested. Rolling returns help you judge a fund’s consistency, but to know what you actually earned, you need your XIRR from your own cash flows.
Fund fact sheets and ads usually show only trailing returns, so you often need a research platform or your own spreadsheet to see rolling returns. Because they require history to compute, a brand-new fund cannot show rolling returns at all, which is one reason new funds are harder to evaluate.
